Propolis is a natural resinous substance collected by honeybees from plant sources and widely used in traditional medicine, dietary supplements, and health products. Its chemical composition can vary significantly depending on factors such as geographical location, plant origin, climate, and harvesting conditions.
Understanding these compositional differences is crucial for evaluating the quality, authenticity, and biological activity of propolis products. Advanced analytical techniques such as EGA-MS and Heart-Cut EGA-GC/MS analysis provide valuable insights into the volatile and semi-volatile compounds present in crude drugs and natural products.
This study investigates propolis samples collected from two different regions and demonstrates how Heart-Cut EGA-GC/MS can be used to identify compositional differences that may influence product quality and therapeutic properties.
Table of Contents
Introduction to Propolis
Why Analyze Propolis Composition?
What is Heart-Cut EGA-GC/MS?
Study Objective
Experimental Setup
Instrumentation and Analytical Conditions
EGA Thermogram Results
Identification of Zone A
Heart-Cut GC/MS Analysis
Differences Between Propolis Samples
Essential Oils and Bioactive Components
Applications of Heart-Cut EGA-GC/MS
Benefits of the Technique
Conclusion
Introduction to Propolis
Propolis is a complex natural material produced by bees using plant resins, waxes, and enzymes. It has been used for centuries in traditional medicine due to its antimicrobial, antioxidant, anti-inflammatory, and immune-supporting properties.
The chemical composition of propolis depends on several factors:
Botanical source
Geographic region
Climate conditions
Harvest season
Bee species
Environmental factors
Because of this variability, detailed compositional analysis is necessary to ensure product consistency and quality.
Why Analyze Propolis Composition?
The therapeutic activity of propolis is directly related to its chemical composition.
Analyzing propolis helps researchers:
Compare products from different regions
Evaluate product quality
Identify bioactive compounds
Verify authenticity
Support pharmaceutical research
Develop standardized formulations
Variations in chemical composition can significantly impact biological activity and commercial value.
What is Heart-Cut EGA-GC/MS?
Heart-Cut EGA-GC/MS is an advanced analytical technique that combines:
Evolved Gas Analysis (EGA)
Thermal extraction
Selective heart-cutting
Gas Chromatography-Mass Spectrometry (GC/MS)
The technique allows researchers to isolate specific temperature regions from an EGA thermogram and perform detailed chemical analysis only on areas of interest.
This targeted approach improves analytical efficiency and enhances compound identification.
Study Objective
The primary objective of this study was to compare the compositions of propolis samples collected from two different geographic areas.
The analysis focused on:
Identifying thermal behavior differences
Comparing evolved gas profiles
Examining volatile compounds
Characterizing bioactive constituents
Investigating essential oils and flavonoids
Experimental Setup
Two propolis samples obtained from different regions were analyzed using EGA-MS.
The EGA thermograms were first examined to identify temperature zones showing significant differences between samples.
A temperature region displaying distinct variations was then isolated using a Selective Sampler and Micro-Jet Cryo-Trap.
The selected zone was subsequently analyzed by GC/MS to identify individual compounds.
This workflow enabled precise comparison of sample compositions.
Instrumentation and Analytical Conditions
The analysis utilized the following instrumentation:
Analytical Instruments
Multi-Functional Pyrolyzer
Selective Sampler
Micro-Jet Cryo-Trap
Vent-Free GC/MS Adapter
GC/MS System
UA-5 Separation Column
Experimental Conditions
Parameter | Condition |
Pyrolysis Temperature | 50–700°C |
Heating Rate | 20°C/min |
Column Head Pressure | 50 kPa |
Split Ratio | 1:50 |
GC Oven Temperature | 40–300°C |
Heating Rate (GC) | 10°C/min |
Sample Size | 300 µg |
MS Scan Range | m/z 29–550 |
Scan Speed | 0.2 scans/sec |
These conditions enabled comprehensive thermal and chromatographic characterization of the propolis samples.
EGA Thermogram Results
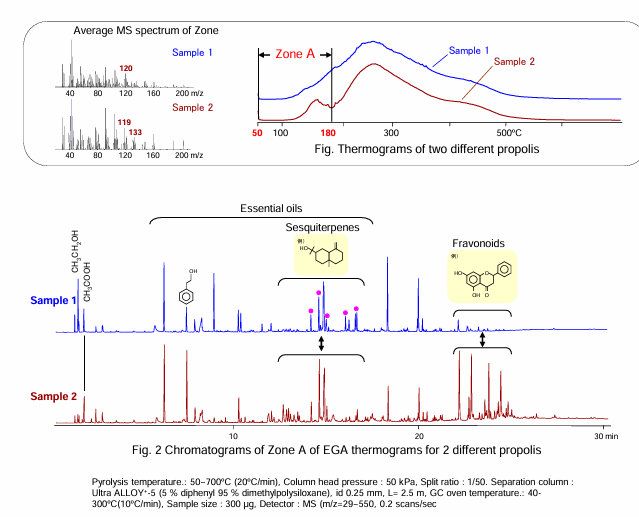
The EGA thermograms revealed noticeable differences between the two propolis samples.
Although both samples exhibited similar overall thermal behavior, one temperature region demonstrated significant variation.
Identified Region
Zone A: 50°C – 180°C
This region displayed:
Different peak profiles
Different peak intensities
Distinct average mass spectra
The observed variations suggested compositional differences between the two samples.
As a result, Zone A was selected for further investigation using Heart-Cut GC/MS analysis.
Identification of Zone A
Zone A represents the low-temperature fraction of the propolis samples.
Compounds released in this temperature range generally include:
Volatile organic compounds
Essential oils
Organic acids
Alcohols
Low-boiling flavonoids
Average mass spectra obtained from Zone A showed distinct differences between the two propolis samples, indicating variations in volatile chemical composition.
Heart-Cut GC/MS Analysis
The selected Zone A fraction was isolated and transferred directly to the GC/MS system for detailed analysis.
The chromatographic results revealed clear differences in peak intensity patterns between the two propolis samples.
Several groups of compounds were identified, including:
Ethanol
CH₃CH₂OH
Ethanol-related compounds contribute to volatile characteristics and extraction profiles.
Acetic Acid
CH₃COOH
Acetic acid is commonly found in natural products and contributes to aroma characteristics.
Essential Oils
Various volatile essential oil components were detected.
These compounds play an important role in the biological activity of propolis.
Differences Between Propolis Samples
The comparison demonstrated that the two propolis samples contained different amounts of volatile constituents.
Major Differences
Different essential oil concentrations
Variations in volatile flavonoids
Distinct chromatographic peak intensities
Different thermal evolution profiles
Although both samples originated from propolis, their chemical compositions were not identical.
These differences likely reflect variations in regional botanical sources.
Essential Oils and Bioactive Components
The most notable differences were observed in compounds associated with:
Essential Oils
Essential oils contribute to:
Antimicrobial activity
Aroma characteristics
Antioxidant properties
Sesquiterpenes
Sesquiterpenes are naturally occurring compounds known for:
Anti-inflammatory effects
Biological activity
Therapeutic potential
Flavonoids
Flavonoids are among the most important bioactive compounds in propolis.
Potential benefits include:
Antioxidant activity
Immune support
Anti-inflammatory properties
Antimicrobial effects
Variations in these compounds can significantly influence product quality and effectiveness.
Applications of Heart-Cut EGA-GC/MS
Heart-Cut EGA-GC/MS is useful for a wide range of applications.
Natural Product Analysis
Herbal medicines
Bee products
Plant extracts
Pharmaceutical Research
Active compound identification
Quality control
Product development
Food and Nutraceutical Analysis
Flavor characterization
Authenticity testing
Ingredient verification
Crude Drug Analysis
Botanical comparison
Chemical profiling
Standardization studies
Benefits of the Technique
Heart-Cut EGA-GC/MS offers several analytical advantages.
Key Benefits
Selective analysis of target temperature zones
Reduced analytical complexity
Improved compound identification
Enhanced sensitivity
Better comparison of similar samples
Efficient characterization of complex mixtures
These advantages make the technique highly valuable for natural product research and quality assessment.
Conclusion
The analysis demonstrated that Heart-Cut EGA-GC/MS is a powerful tool for comparing propolis samples obtained from different geographic regions. By combining evolved gas analysis with targeted GC/MS characterization, researchers can identify compositional differences that may not be apparent through conventional analysis alone.
The study revealed significant variations within the 50°C–180°C temperature range, particularly in the abundance of essential oils, sesquiterpenes, and volatile flavonoids. These compounds are closely associated with the biological activity and quality of propolis products.
For advanced solutions in EGA-MS, Heart-Cut GC/MS, and crude drug analysis, Frontier Laboratories SEA provides innovative analytical technologies designed for detailed characterization of natural products, pharmaceuticals, and complex materials.
References: This technical note was developed by Frontier Laboratories Ltd. 4-16-20 Saikon, Koriyama, Fukushima, 963-8862 JAPAN. www.frontier-lab.com