Quantitative Microplastics Analysis Using Py-GC/MS
Introduction
Microplastics (MPs) have become an important environmental concern due to their widespread presence in water, soil, sediments, food, and other environmental samples. Accurate identification and quantification of these particles require reliable analytical techniques and suitable calibration standards.
Pyrolysis-Gas Chromatography/Mass Spectrometry (Py-GC/MS) is a powerful analytical technique for identifying and quantifying microplastics based on the characteristic pyrolysis products generated from different polymers.
A calibration standard containing multiple polymers can help establish a relationship between the amount of polymer present and the peak area of its characteristic pyrolyzate. This makes quantitative microplastics analysis more reliable and reproducible.
Calibration Standard for Microplastics Analysis
The MPs-SiO₂ calibration standard uses silica (SiO₂) as a diluent and contains 11 commonly analyzed polymers. The standard can be used to develop calibration curves for quantitative microplastics analysis using Py-GC/MS.
In this method, different amounts of the calibration standard are analyzed, and the peak areas of selected characteristic pyrolysis products are measured. These data are then used to construct calibration curves for each polymer.
Experimental Approach
For the calibration study, 0.4 mg, 2 mg, and 4 mg of the MPs-SiO₂ standard were placed into an Eco-Cup LF.
The samples were analyzed using the Py-GC/MS method, with the peak areas of specific indicator ions selected from extracted ion chromatograms. Calibration curves were subsequently created for the 11 polymers.
The GC was operated in constant-pressure mode at 150 kPa, with a split ratio of 1/50, while the mass spectrometer was operated in scan mode.
The limit of detection (LOD) was calculated using:
LOD = 3.3s/a
where s represents the standard deviation at the lowest concentration and a represents the slope of the calibration curve.
11 Polymers Included in the Calibration
The calibration standard provides characteristic pyrolyzates that can be used as indicators for individual polymers.
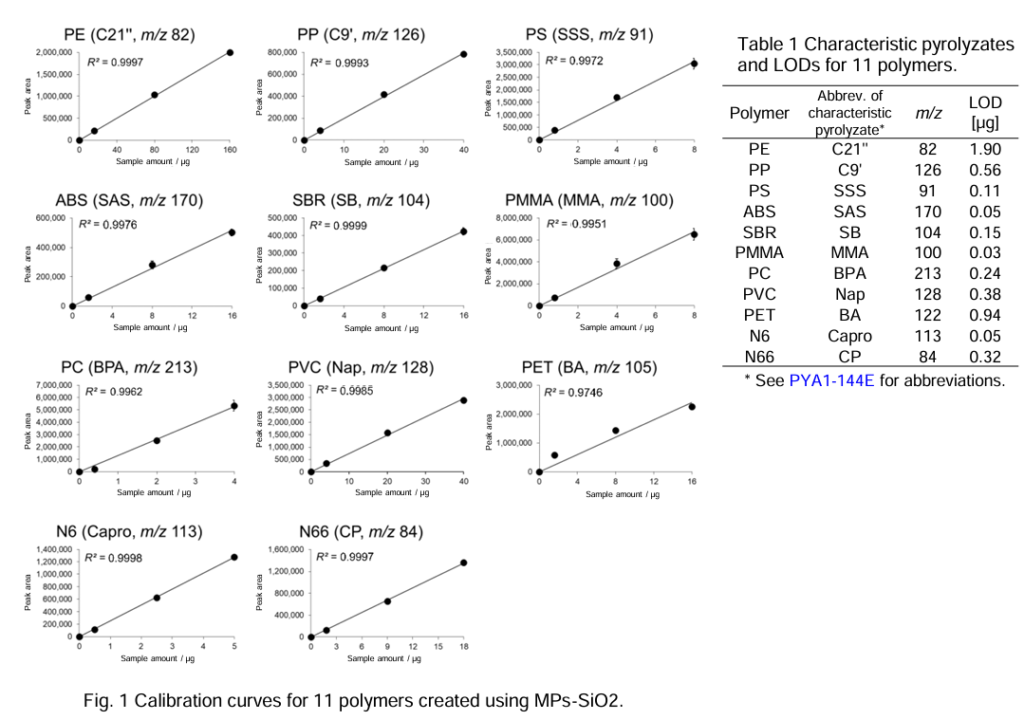
Polymer | Abbreviation | Characteristic Pyrolyzate | m/z | LOD (µg) |
Polyethylene | PE | C21” | 82 | 1.90 |
Polypropylene | PP | C9′ | 126 | 0.56 |
Polystyrene | PS | SSS | 91 | 0.11 |
Acrylonitrile Butadiene Styrene | ABS | SAS | 170 | 0.05 |
Styrene-Butadiene Rubber | SBR | SB | 104 | 0.15 |
Polymethyl Methacrylate | PMMA | MMA | 100 | 0.03 |
Polycarbonate | PC | BPA | 213 | 0.24 |
Polyvinyl Chloride | PVC | Nap | 128 | 0.38 |
Polyethylene Terephthalate | PET | BA | 122 | 0.94 |
Nylon 6 | N6 | Capro | 113 | 0.05 |
Nylon 66 | N66 | CP | 84 | 0.32 |
Calibration Curve and Linearity
Calibration curves are created by plotting the peak area of each characteristic pyrolyzate against the corresponding sample amount.
The resulting calibration curves showed good linearity for most of the polymers. The coefficient of determination (R²) was greater than 0.99 for 10 of the 11 polymers, demonstrating a strong relationship between polymer concentration and analytical response.
PET was an exception, showing comparatively different calibration behavior when using the SiO₂-based standard.
For quantitative analysis of PET, a calibration standard using CaCO₃ as the diluent, such as MPs-CaCO₃, may be more appropriate.
Importance of the Limit of Detection
The LOD indicates the lowest amount of a polymer that can be reliably detected using the analytical method.
Among the polymers evaluated, PMMA showed the lowest reported LOD at 0.03 µg, while PE showed a higher LOD of 1.90 µg.
Understanding the LOD is important when analyzing environmental samples containing very small quantities of microplastics. A lower LOD can provide greater sensitivity for detecting trace levels of specific polymers.
Why Py-GC/MS Is Useful for Microplastics Analysis
Py-GC/MS offers several advantages for polymer analysis:
- Polymer-specific identification through characteristic pyrolysis products
- Quantitative analysis using calibration curves
- Detection of multiple polymer types within a single analytical workflow
- Useful for complex environmental and material samples
- High analytical sensitivity for several polymer types
- Ability to distinguish polymers based on their chemical composition
Unlike methods that rely primarily on the physical appearance or morphology of particles, Py-GC/MS provides chemical information that can help confirm polymer identity.
Applications of Quantitative Microplastics Analysis
Reliable polymer calibration is important for microplastics research across several areas, including:
Environmental Analysis
Microplastics can be investigated in water, sediment, soil, and other environmental matrices.
Food and Beverage Analysis
Py-GC/MS can support studies investigating polymer contamination in food-related samples and packaging materials.
Polymer and Material Research
The technique can be used to characterize polymer-containing materials and investigate their composition.
Trace Analysis
The established calibration curves and LOD values can support the detection and quantification of low concentrations of polymer materials.
Conclusion
Accurate quantification is an essential part of microplastics research. The use of an MPs-SiO₂ calibration standard with Py-GC/MS provides a practical approach for developing calibration curves for multiple polymer types.
The reported calibration results demonstrate good linearity for most of the 11 polymers evaluated, with R² values above 0.99 for 10 polymers. The characteristic pyrolyzates and corresponding LODs also provide useful information for selecting appropriate analytical conditions.
For applications involving PET, the use of a CaCO₃-based calibration standard may provide better quantitative performance.
Overall, calibration standards combined with Py-GC/MS can contribute to more consistent, sensitive, and reliable identification and quantification of microplastics in environmental and material analysis.
Contact Us:
Frequently Asked Questions (FAQs)
Py-GC/MS is used to identify and quantify microplastics by analyzing characteristic pyrolysis products of different polymers.
MPs-SiO₂ is a microplastic calibration standard that uses silica (SiO₂) as a diluent for quantitative polymer analysis.
The calibration standard covers 11 polymers, including PE, PP, PS, ABS, SBR, PMMA, PC, PVC, PET, N6, and N66.
Calibration curves are created by comparing the peak area of characteristic pyrolyzates with the corresponding amount of each polymer.
LOD represents the lowest amount of a polymer that can be reliably detected by the analytical method.
Among the 11 polymers evaluated, PMMA has the lowest reported LOD at 0.03 µg.
For PET quantification, an MPs-CaCO₃ calibration standard may be recommended because PET showed different calibration behavior with the SiO₂-based standard.