How EGA-MS and Py-GC/MS Help Differentiate Natural and Synthetic Beeswax
Introduction to Beeswax Analysis
Beeswax is a natural wax composed of a complex mixture of hydrocarbons, esters, and other organic compounds. Because natural waxes can have similar physical characteristics, identifying differences in their chemical composition is important when assessing material identity, quality, and possible adulteration.
Synthetic waxes can contain straight-chain hydrocarbons that may also occur in natural waxes. Therefore, examining a sample’s overall chemical profile can provide more useful information than relying on a single compound or physical property.
Beeswax analysis using EGA-MS and Py-GC/MS provides complementary information about the thermal behavior and chemical composition of wax samples. These techniques can help distinguish different beeswaxes and identify compositional patterns that may indicate the addition of synthetic wax.
Why Differentiate Natural Beeswax from Synthetic Wax?
Differentiating natural beeswax from synthetic wax is relevant to material characterization, quality assessment, and forensic investigations.
When a wax sample may contain a mixture of natural and synthetic materials, analytical methods can help identify differences in its chemical profile.
Key objectives include:
Comparing the composition of different natural beeswax samples.
Identifying differences between natural beeswax and synthetic wax.
Examining the distribution of hydrocarbons and other organic compounds.
Investigating compositional changes that may suggest the addition of synthetic material.
Supporting forensic differentiation of samples with similar physical properties.
A combination of thermal analysis and chromatographic profiling can provide a more comprehensive characterization of complex wax mixtures.
What Is EGA-MS Analysis?
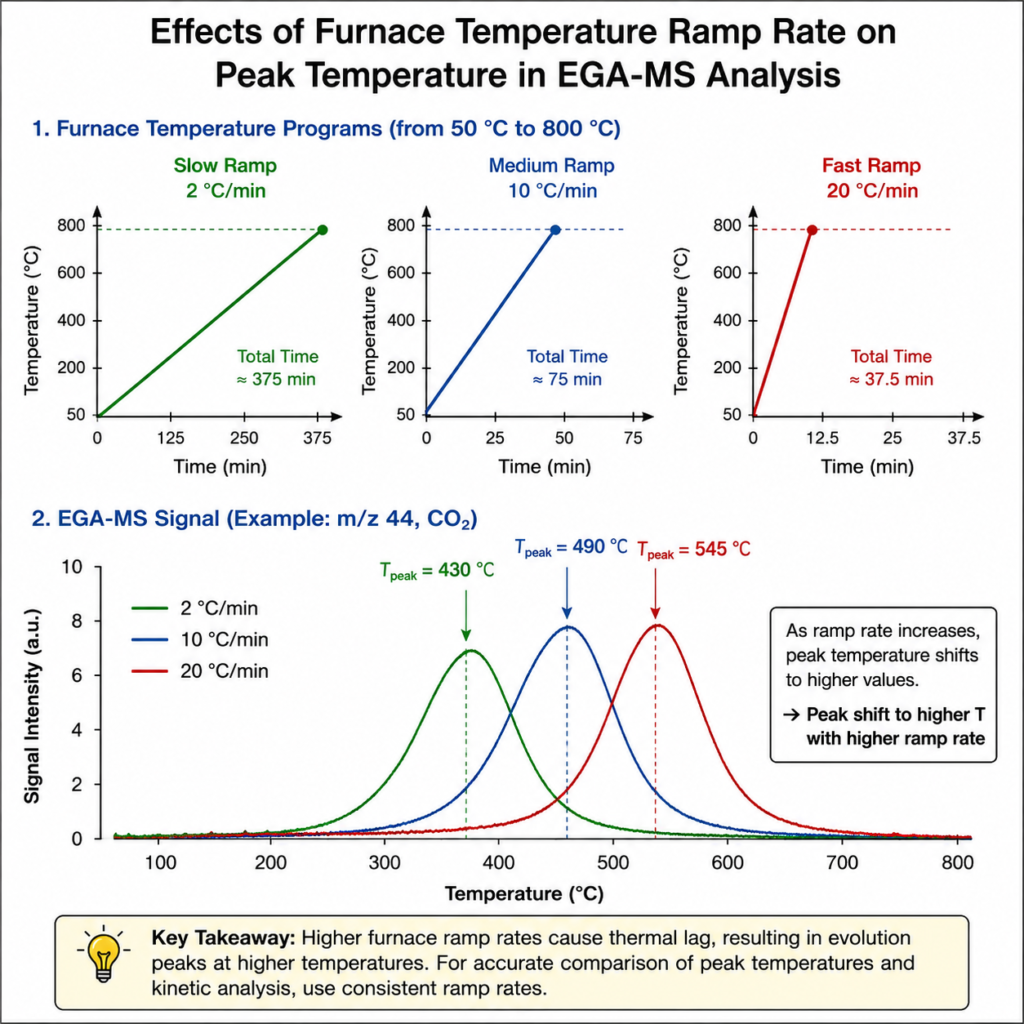
Evolved Gas Analysis coupled with Mass Spectrometry (EGA-MS) is an analytical technique used to examine compounds released from a sample as its temperature increases.
During EGA-MS analysis, the sample is heated according to a defined temperature program. The evolved compounds are transferred to a mass spectrometer, allowing their thermal release behavior to be investigated.
For beeswax characterization, EGA-MS can help identify differences in the temperature ranges at which groups of compounds are released.
In the comparative analysis of two beeswaxes and one synthetic wax, the EGA thermograms showed two main groups of compounds:
Group A: Straight-chain hydrocarbons eluting between approximately 100°C and 300°C.
Group B: A group of compounds eluting between approximately 320°C and 600°C, observed in the two beeswax samples but absent from the synthetic wax.
The presence or absence of these compound groups provides a useful basis for comparing the samples.
How Py-GC/MS Supports Beeswax Characterization
Pyrolysis-Gas Chromatography/Mass Spectrometry (Py-GC/MS) combines thermal decomposition with gas chromatographic separation and mass spectrometric detection.
In this technique, a small sample is rapidly heated under controlled conditions. The resulting products are separated by gas chromatography and analyzed using mass spectrometry.
Py-GC/MS provides detailed information about the chemical composition of complex materials. For wax samples, the distribution of hydrocarbons and the presence of characteristic compounds can help reveal differences between samples.
When used alongside EGA-MS, Py-GC/MS provides complementary information: EGA-MS highlights thermal release patterns, while Py-GC/MS helps compare the chemical profiles of the samples.
Learn more about Pyrolysis-GC/MS and its analytical applications.
Analytical Approach for Differentiating Beeswaxes
The comparative analysis examined three samples:
Beeswax C
Beeswax J
Synthetic wax
Approximately 150 µg of each sample was analyzed using a multi-functional pyrolyzer connected to a GC/MS system.
The analysis was performed in two stages.
1. EGA-MS Analysis
The samples were first analyzed using EGA-MS, with the furnace temperature increased from 100°C to 600°C at a rate of 20°C per minute.
The resulting thermograms were compared to identify differences in the temperature ranges and relative abundance of evolved compound groups.
All three samples showed Group A, consisting of straight-chain hydrocarbons released between approximately 100°C and 300°C.
However, Group B, observed between approximately 320°C and 600°C, was present in both beeswax samples and absent from the synthetic wax.
The ratio of the peak areas of Groups A and B also differed between the natural beeswax samples.
2. Py-GC/MS Analysis
The samples were then analyzed using Py-GC/MS at a furnace temperature of 600°C.
The resulting chromatograms, known as pyrograms, were compared to examine hydrocarbon distributions and other characteristic compounds.
This second stage provided additional information about the chemical differences between the three samples.
EGA-MS Results: Differences in Beeswax Composition
The EGA-MS results revealed differences in the thermal profiles of the two beeswaxes and the synthetic wax.
Differences in Evolved Compound Groups
Group A appeared in all three samples and consisted of straight-chain hydrocarbons released between approximately 100°C and 300°C.
Group B appeared in Beeswax C and Beeswax J but was not observed in the synthetic wax. This difference helped distinguish the natural beeswaxes from the synthetic material.
The relative peak-area ratios also showed substantial differences between the two beeswax samples.
| Sample | Group A/Group B peak-area ratio | Observation |
|---|---|---|
| Beeswax C | 0.65 | Relatively greater contribution from Group B |
| Beeswax J | 2.3 | Relatively greater contribution from Group A |
| Synthetic wax | Not reported | Group B was not observed |
The ratio differences indicate that Beeswax C and Beeswax J had different chemical compositions.
Beeswax C showed a greater relative contribution from Group A than Beeswax J, a pattern that was considered consistent with the possible addition of synthetic wax.
These ratios are comparative analytical observations; they should not be interpreted as direct measurements of the percentage of synthetic wax in a sample.
Py-GC/MS Results: Hydrocarbon Distribution and Ester Profiles
Py-GC/MS provided additional evidence of differences in the samples’ chemical composition.
Straight-Chain Hydrocarbons
The synthetic wax showed a series of straight-chain hydrocarbons ranging from C24 to C36.
The distribution of saturated hydrocarbons also differed between the two beeswax samples.
Beeswax J: Hydrocarbons with an odd number of carbon atoms were predominantly observed.
Beeswax C: Hydrocarbons with both odd and even numbers of carbon atoms were present in nearly equal amounts.
Beeswax C therefore showed a hydrocarbon distribution more similar to that of the synthetic wax than Beeswax J did.
Palmitic Acid Esters
Both Beeswax C and Beeswax J contained palmitic acid esters of higher alcohols, including alcohols ranging from C24 to C36.
These compounds provided further information for comparing the natural beeswax samples with the synthetic wax.
The combined differences in hydrocarbon distribution, ester profiles, and EGA-MS thermal behavior supported the interpretation that the samples had distinct compositions.
Can EGA-MS and Py-GC/MS Help Identify Beeswax Adulteration?
The combination of EGA-MS and Py-GC/MS can help investigate whether a beeswax sample contains a synthetic component.
In this comparison, Beeswax C displayed two important characteristics:
Its relative contribution from Group A was greater than that of Beeswax J.
Its distribution of odd- and even-carbon-numbered hydrocarbons was more similar to that of the synthetic wax.
Together, these observations suggested that synthetic wax had probably been added to Beeswax C.
However, this conclusion is a compositional interpretation based on the observed analytical profiles. The comparison did not establish the exact amount of synthetic wax present.
For samples requiring quantitative determination, an appropriate calibration strategy and further method validation would be necessary.
Advantages of Combining EGA-MS and Py-GC/MS
Using both techniques provides complementary information for characterizing complex organic materials.
1. Small sample requirements
The comparative analysis demonstrated the use of approximately 150 µg of sample, making the approach suitable for applications where only a small amount of material is available.
2. Complementary analytical information
EGA-MS reveals differences in thermal release patterns, while Py-GC/MS provides detailed information about the resulting chemical profiles.
3. Differentiation of similar materials
Comparing multiple features, including hydrocarbon distributions and characteristic compound groups, can help distinguish samples that may otherwise appear similar.
4. Reduced sample preparation
The demonstrated approach analyzed the wax samples directly without additional sample pretreatment, reducing opportunities for contamination introduced during preparation.
5. Forensic applications
The ability to compare small samples using their chemical profiles makes these techniques relevant to forensic material differentiation.
Instrumentation for Beeswax Analysis
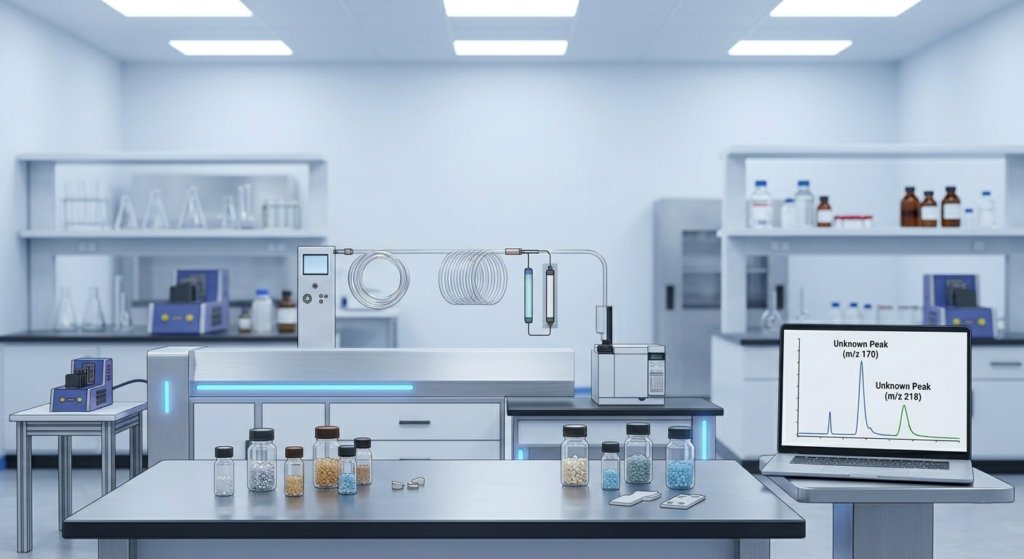
A multi-functional pyrolyzer connected to a GC/MS system can be configured to perform EGA-MS and Py-GC/MS analysis.
The configuration used for this comparative study included:
| Parameter | Analytical conditions |
|---|---|
| Sample amount | Approximately 150 µg |
| EGA-MS furnace temperature | 100–600°C |
| EGA-MS heating rate | 20°C/min |
| Py-GC/MS furnace temperature | 600°C |
| EGA connection | Deactivated metal capillary tube |
| Py-GC/MS separation | Ultra ALLOY+-5 metal capillary column |
| Detection | Mass spectrometry |
The same analytical system was used to obtain complementary thermal and chemical information from the samples.
Explore the available Frontier Laboratories analytical products to learn more about instrumentation for thermal analysis and pyrolysis-based material characterization.
Applications of EGA-MS and Py-GC/MS in Material Characterization
Beyond beeswax differentiation, EGA-MS and Py-GC/MS can be useful for investigating complex organic materials where thermal behavior and chemical composition provide important identification clues.
Potential application areas include:
Wax characterization: Comparing natural waxes, synthetic waxes, and wax mixtures.
Forensic material differentiation: Investigating compositional differences between samples.
Polymer analysis: Examining thermal decomposition behavior and characteristic chemical profiles.
Additive analysis: Investigating organic additives in complex materials.
Advanced materials research: Characterizing materials through their evolved compounds and pyrolysis products.
The appropriate analytical method depends on the sample type, target compounds, and the objective of the investigation.
Conclusion
Beeswax analysis using EGA-MS and Py-GC/MS provides complementary insights into the thermal behavior and chemical composition of natural and synthetic waxes.
EGA-MS distinguished the samples through differences in evolved compound groups and their relative peak-area ratios. Py-GC/MS provided further evidence through differences in straight-chain hydrocarbon distributions and the presence of palmitic acid esters.
In the comparative study, Beeswax C showed characteristics more similar to the synthetic wax than Beeswax J did, suggesting possible synthetic wax addition. The results demonstrate how combining thermal and chemical profiling can support the differentiation of complex wax mixtures.
For researchers investigating waxes and other organic materials, these techniques offer a useful approach to sample characterization and forensic differentiation.
For more information about analytical instrumentation and application-specific solutions, contact Frontier Laboratories SEA.
Frequently Asked Questions (FAQs)
It is an analytical approach that combines evolved gas analysis with mass spectrometry and pyrolysis-GC/MS to compare the thermal behavior and chemical composition of beeswax and synthetic wax samples.
EGA-MS compares the temperature-dependent release of compounds from each sample. In this study, the natural beeswaxes showed an additional group of compounds between approximately 320°C and 600°C that was not observed in the synthetic wax.
Py-GC/MS provides information about the chemical profiles of the samples, including straight-chain hydrocarbon distributions and other characteristic compounds.
Py-GC/MS can reveal compositional similarities and differences that may indicate the presence of synthetic material. In this comparison, the hydrocarbon distribution of Beeswax C was more similar to that of the synthetic wax, suggesting possible addition.
The comparative analysis used approximately 150 µg of each sample. The sample amount required for other applications will depend on the material and analytical method.
EGA-MS examines compounds released as a sample is heated over a temperature range. Py-GC/MS rapidly heats the sample to generate products that are separated by gas chromatography and analyzed by mass spectrometry. The techniques provide complementary information.
The comparative results described here suggest possible synthetic wax addition but do not establish its exact percentage. Quantitative determination would require an appropriate calibration approach and method validation.
Broader Applications in Material Science and Forensic Analysis
Advanced thermal analysis and pyrolysis-gas chromatography methods support material characterization across research laboratories and industrial sectors in India and Southeast Asia.
Advanced Materials Characterization: Investigating complex organic materials, comparing chemical compositions, and characterizing materials such as natural and synthetic waxes.
Applied Pyrolysis Research: Exploring EGA-MS and Py-GC/MS applications for identifying thermal behavior and differentiating complex material mixtures.
Plastics & Rubber Analysis: Characterizing polymer materials, examining additive profiles, and investigating thermal decomposition products.
Paints and Coatings Analysis: Studying the chemical composition and thermal behavior of coating materials and related organic compounds.
Microplastics Analysis: Exploring analytical approaches for investigating microplastic composition and polymer identification.
Combining EGA-MS and Py-GC/MS can provide complementary information for material differentiation, compositional analysis, and forensic investigations. The most appropriate analytical approach depends on the sample and the objective of the study.
To learn more about Frontier Laboratories’ analytical instrumentation, visit our Products page. For application-specific guidance or customized analytical configurations, contact Frontier Laboratories SEA.